
Spotify Wrapped Dashboard
My Submission for Maven Music Challenge (Jan 2025)

My Submission for Maven Music Challenge (Jan 2025)

Understanding Guest Cancellations

A Power BI Analysis of Drug Demand in a Pharmacy in Serbia
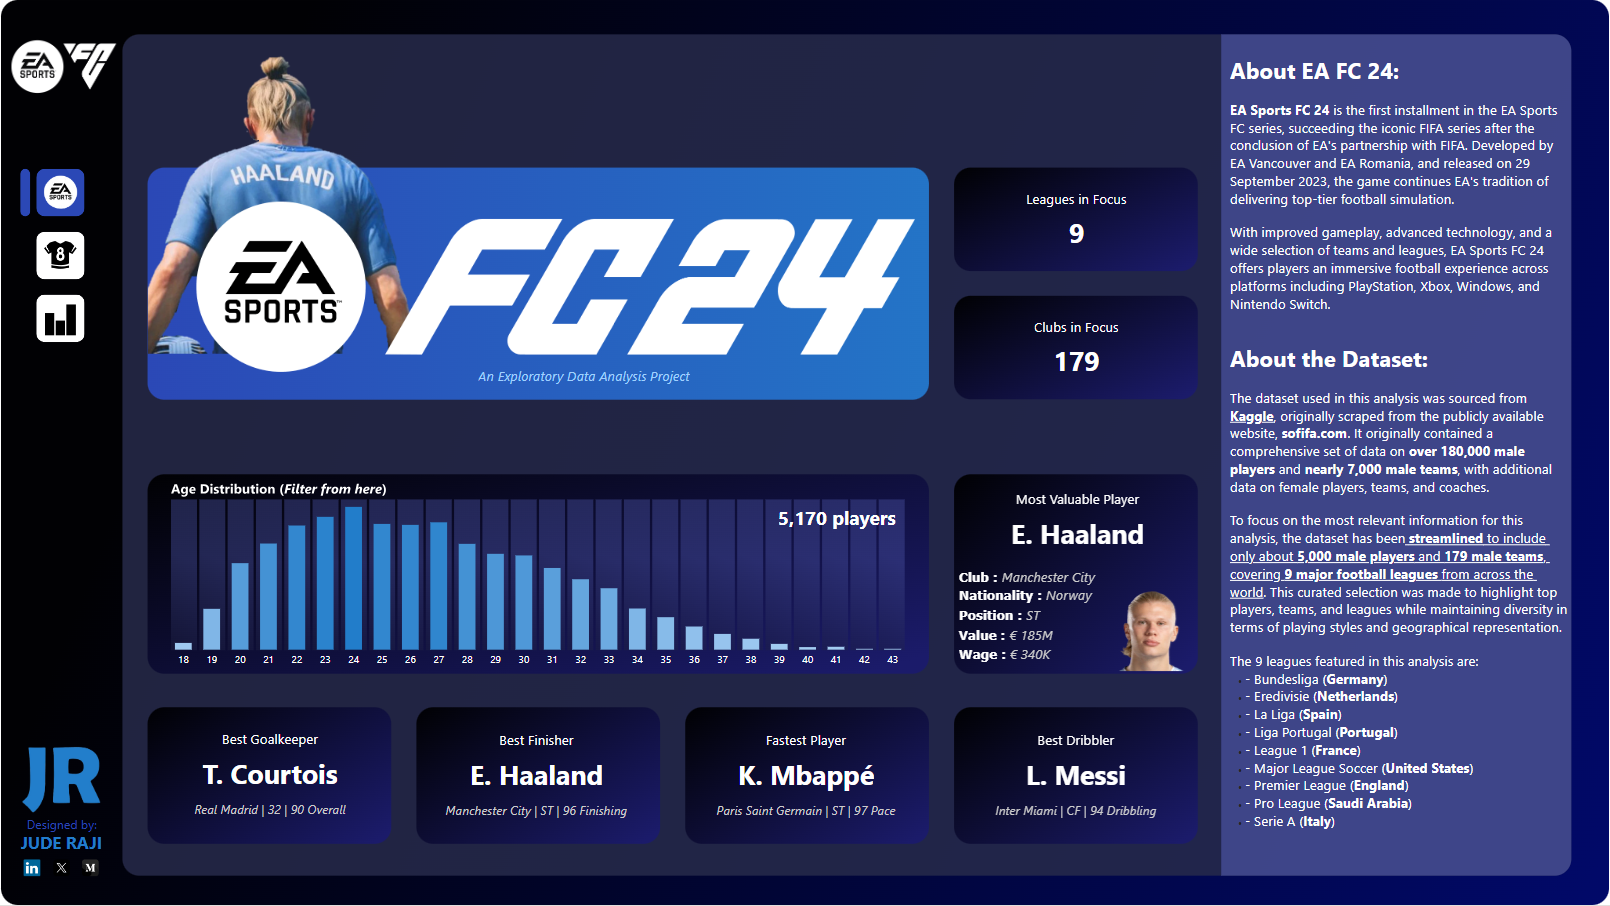
A Data-Driven Expose into Football’s Top Players and Leagues.
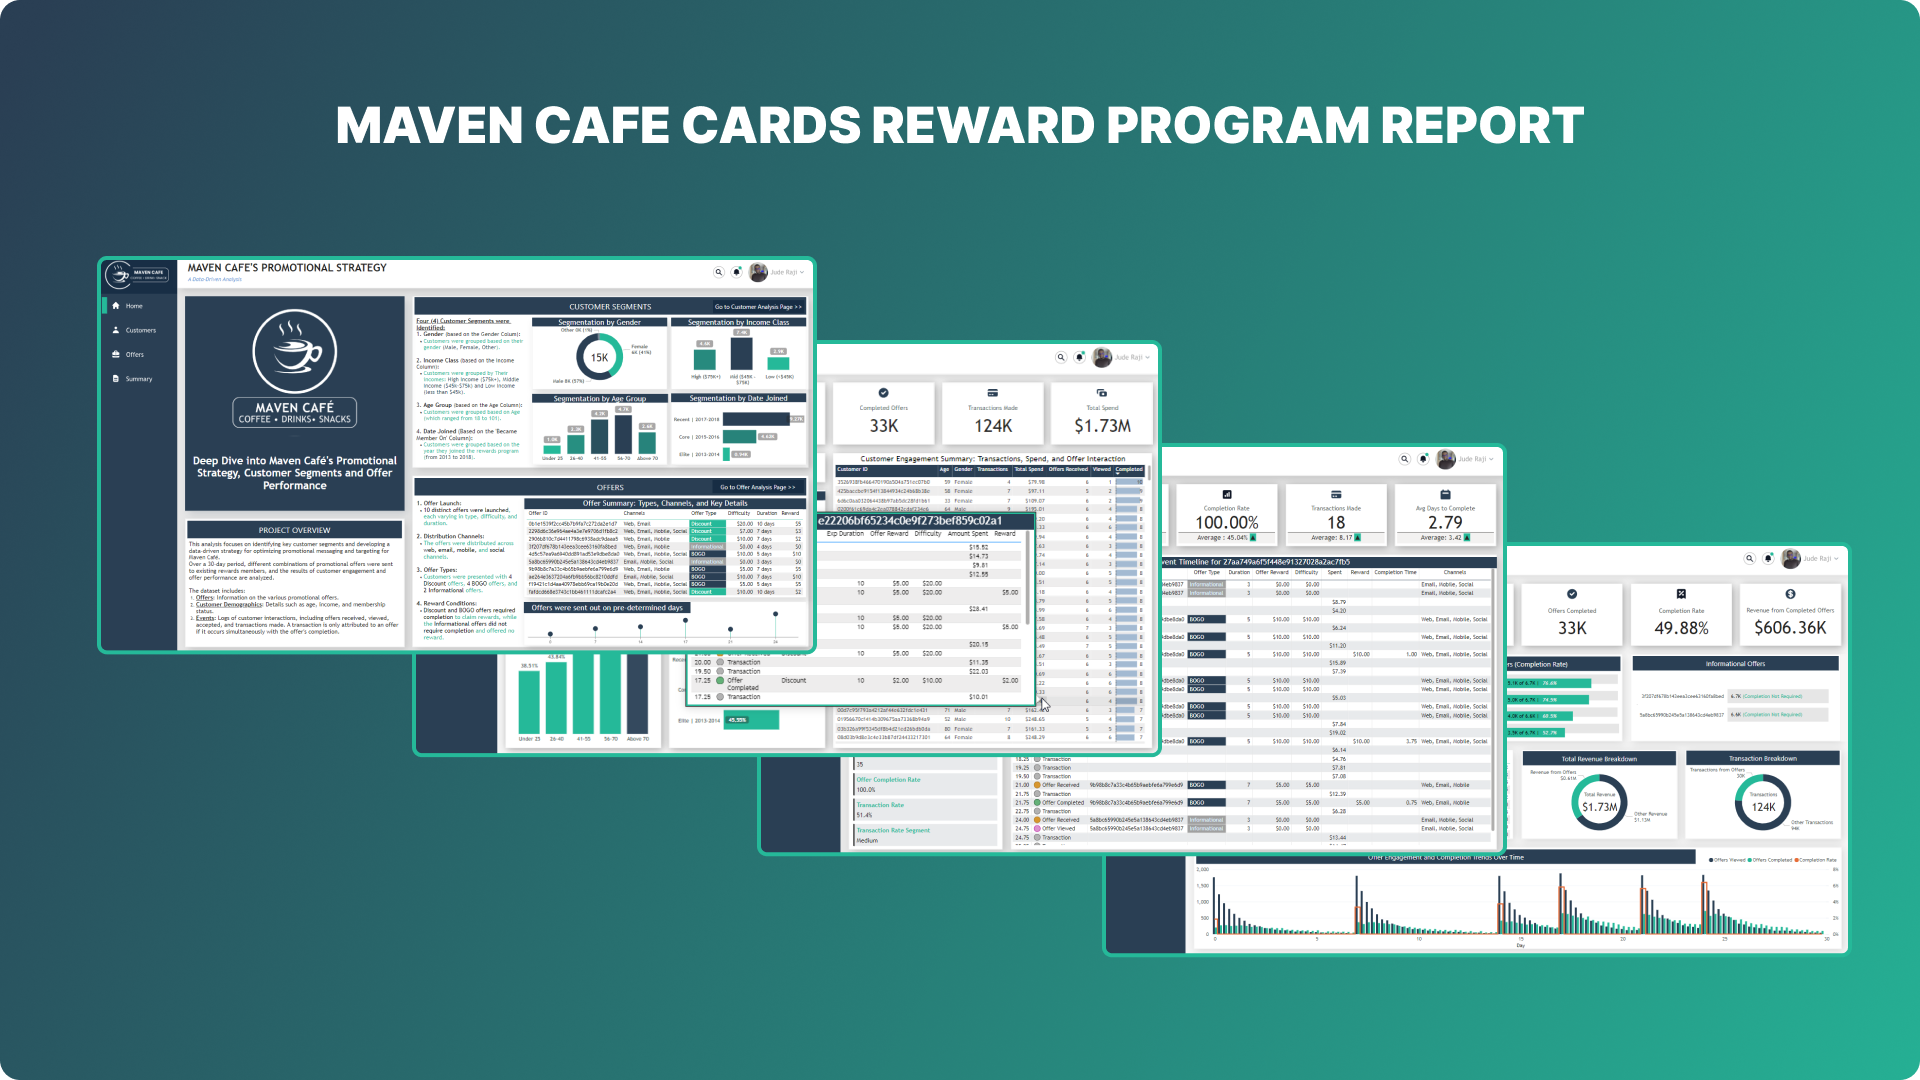
This analysis focuses on identifying key customer segments and developing a data-driven strategy for optimizing promotional messaging and targeting for Maven Cafe

I analyzed the financials of a Fitness company focusing on three major products: Sportswear, Sports Equipment, and Nutrition & Food Supplements
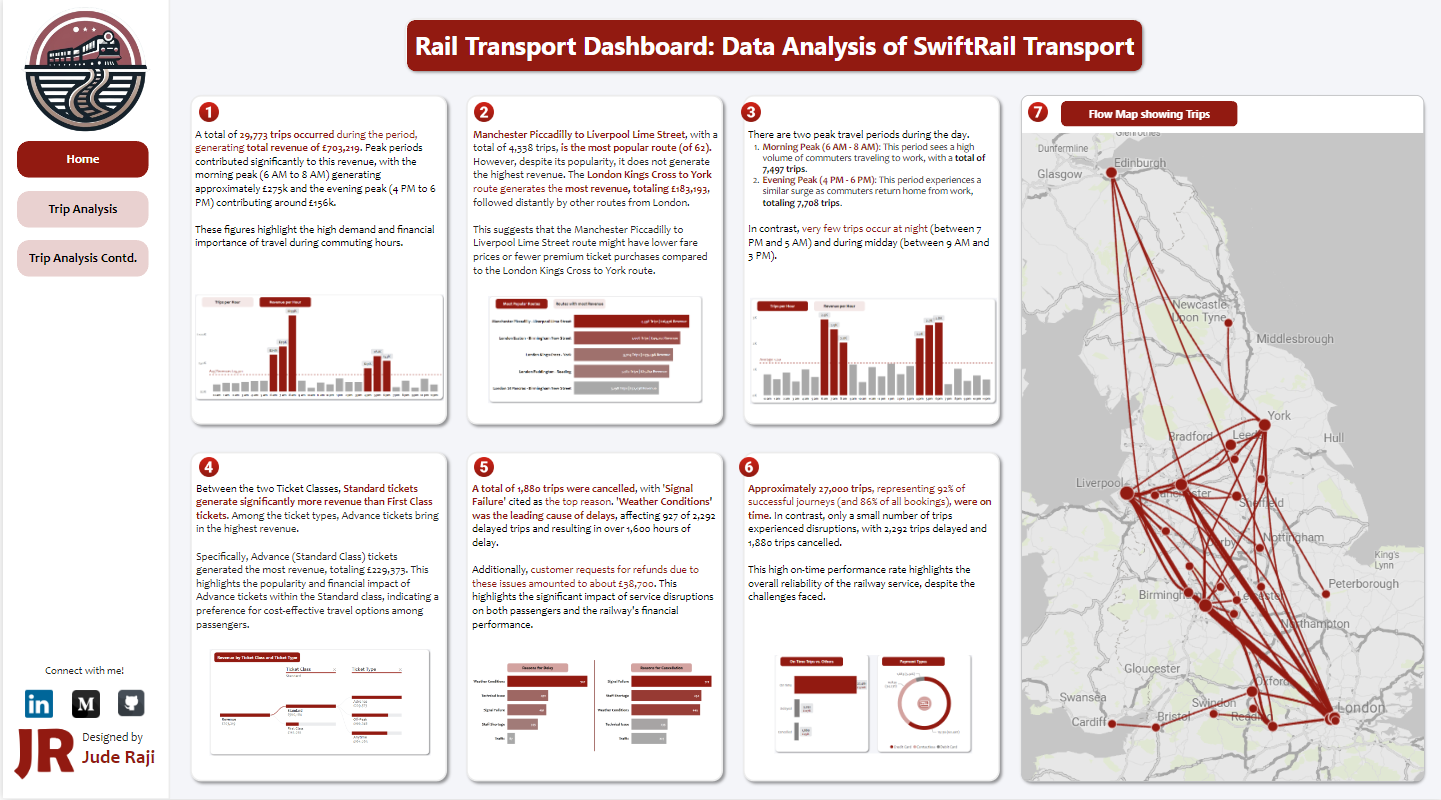
I analyzed a fictional Rail Transport Company, uncovering insights into routes, peak times, revenue, and delays, providing recommendations for improved efficiency and satisfaction.
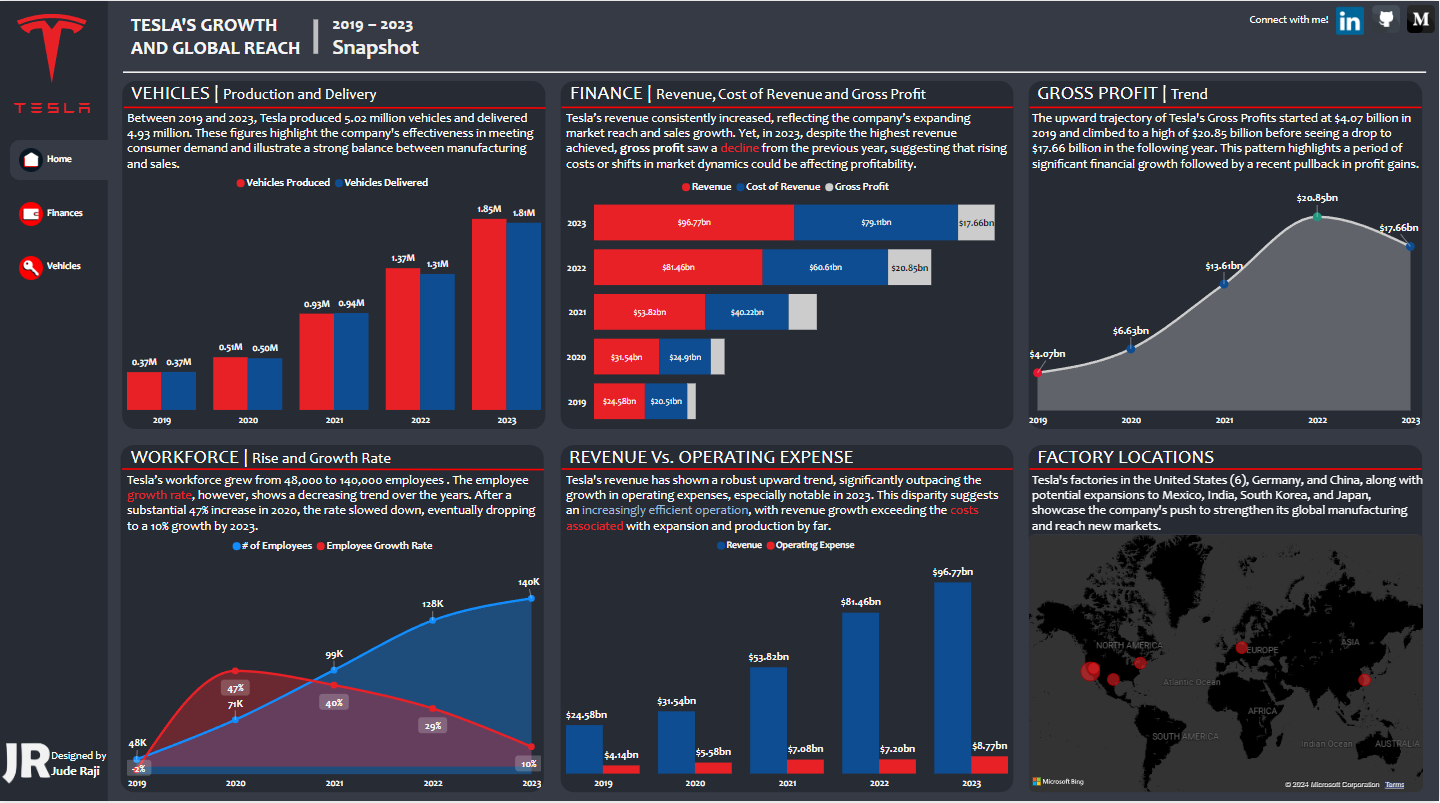
Analysis of Tesla's performance from 2019 to 2023 - focusing on vehicle production, workforce expansion, financial outcomes, and global factory locations.
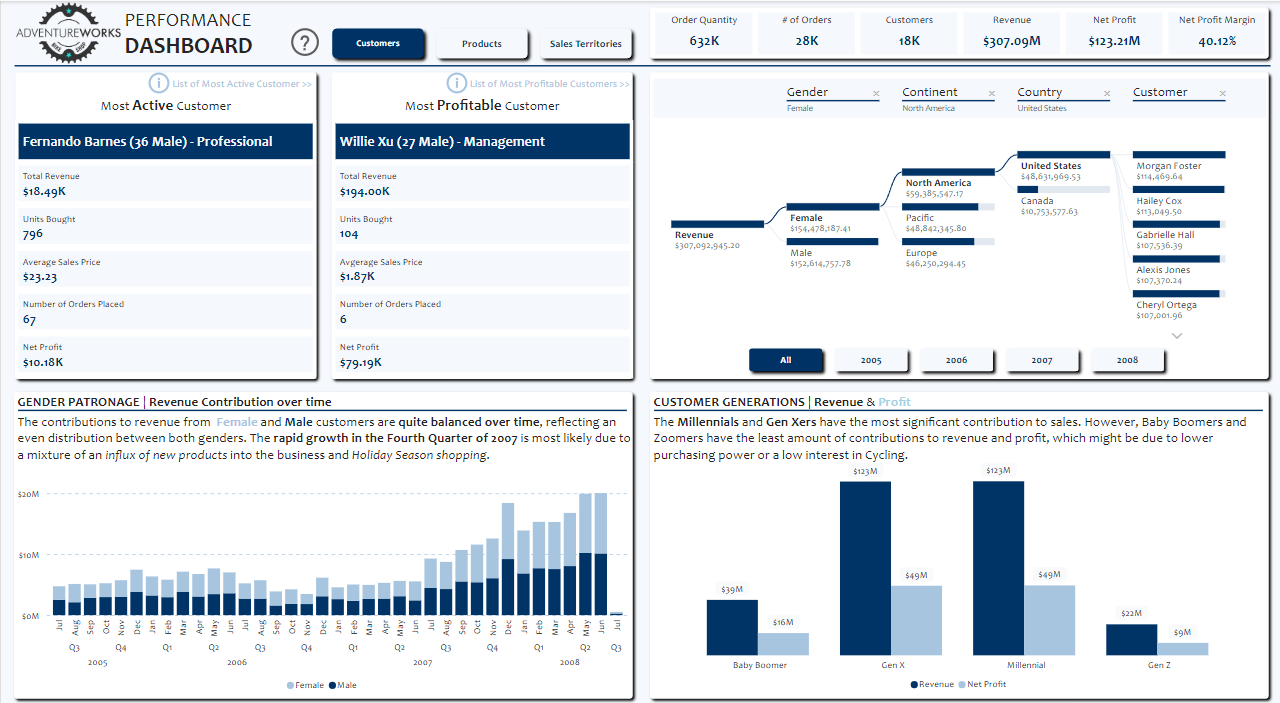
For this project, we explore sales and customer data to uncover insights that guide business decisions at AdventureWorks.
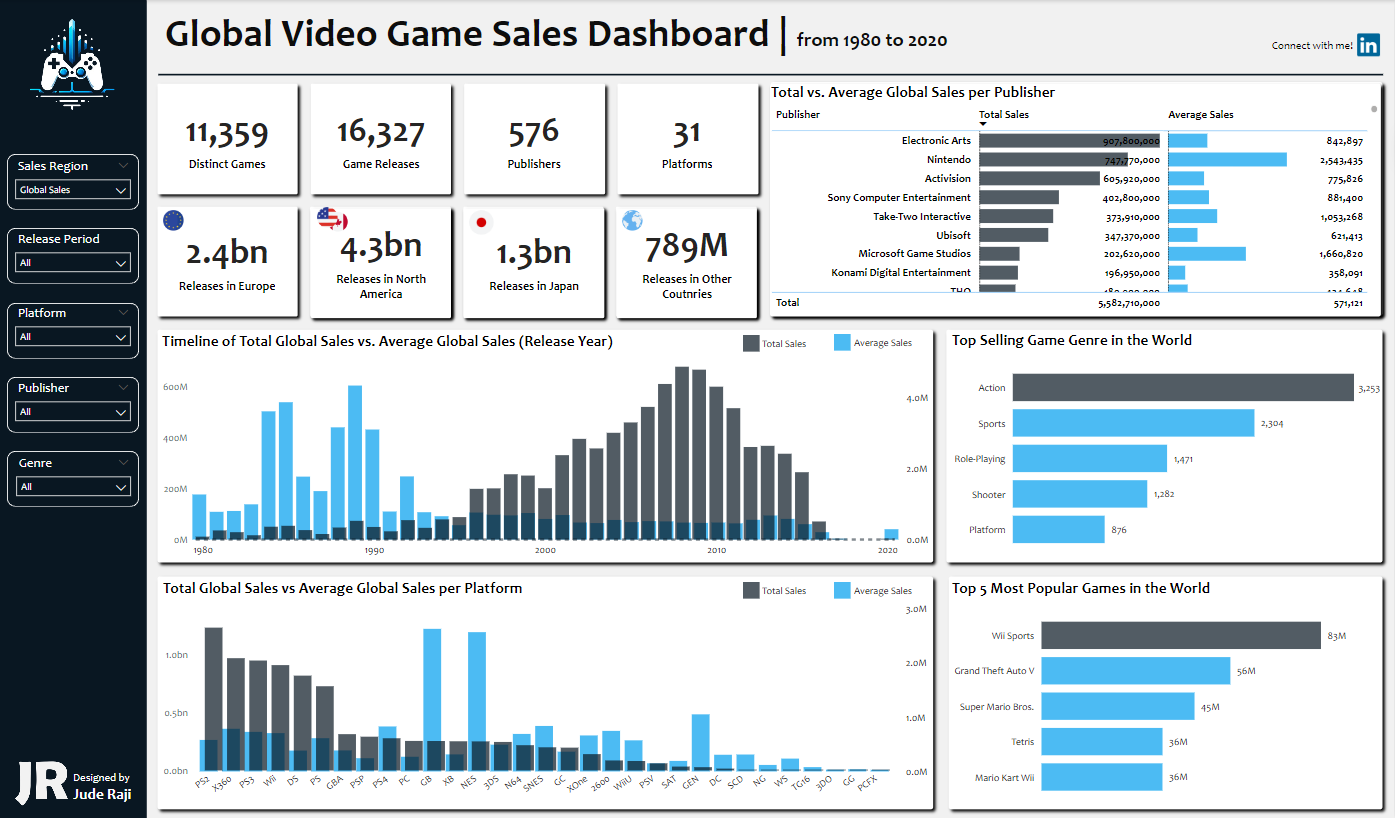
This dashboard offers insights into the trends and shifts within the global video game industry, highlighting key factors that have influenced its evolution over the years.
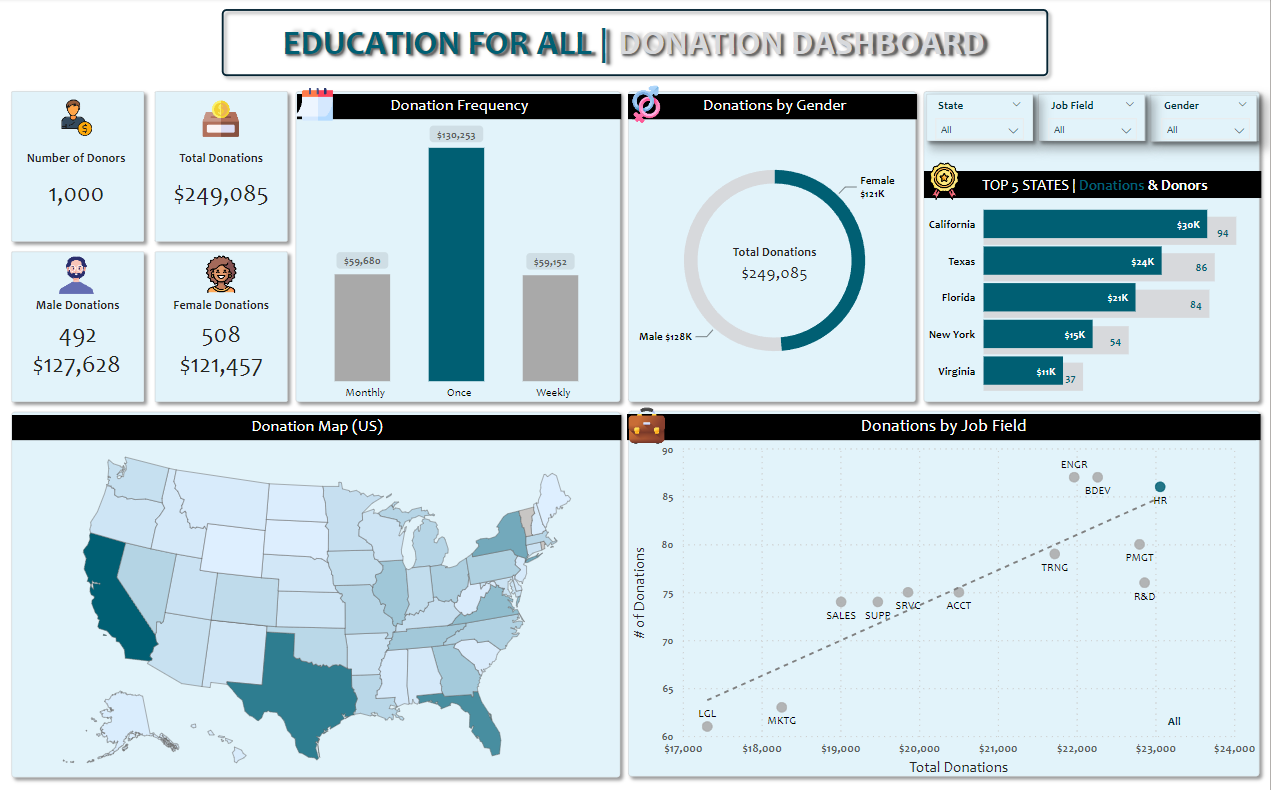
I analyzed an educational charity's donor data, uncovering insights to boost fundraising. Highlighted strategic outreach based on state and job insights.
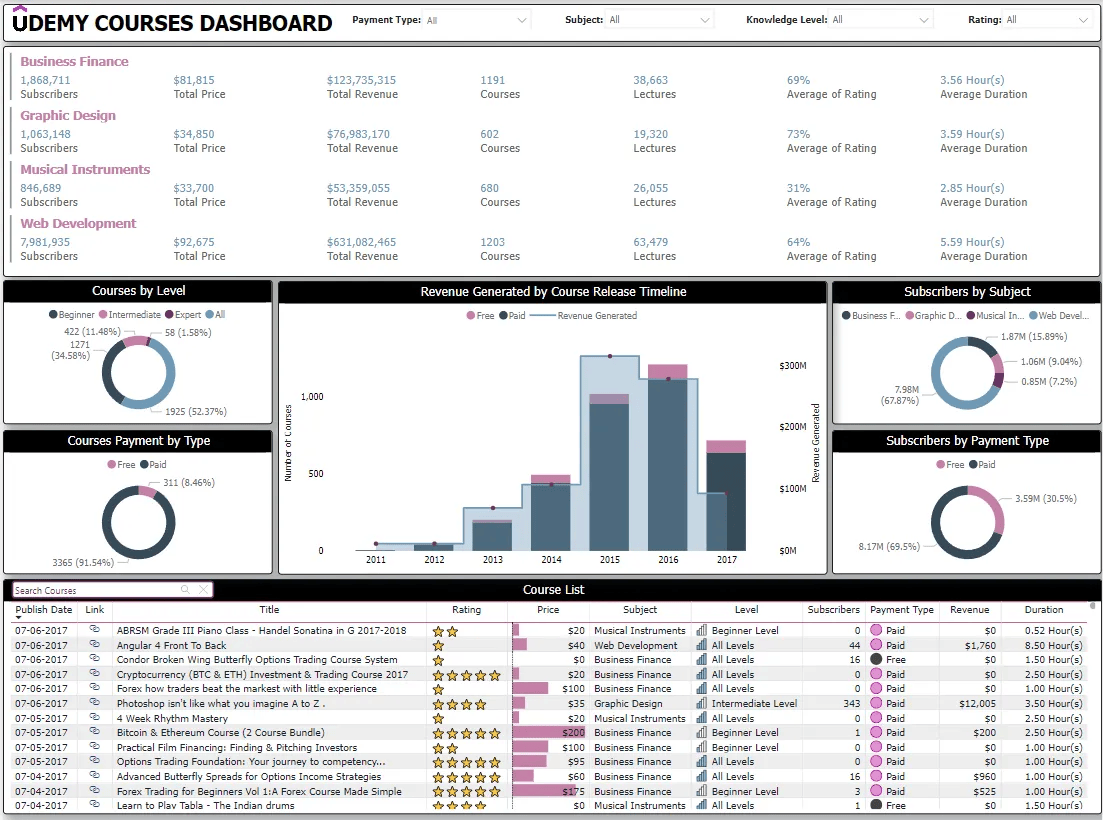
Analysis of Udemy's performance from 2011 to 2017 - focusing on course offerings, subscriber growth, revenue generation, and audience engagement trends.
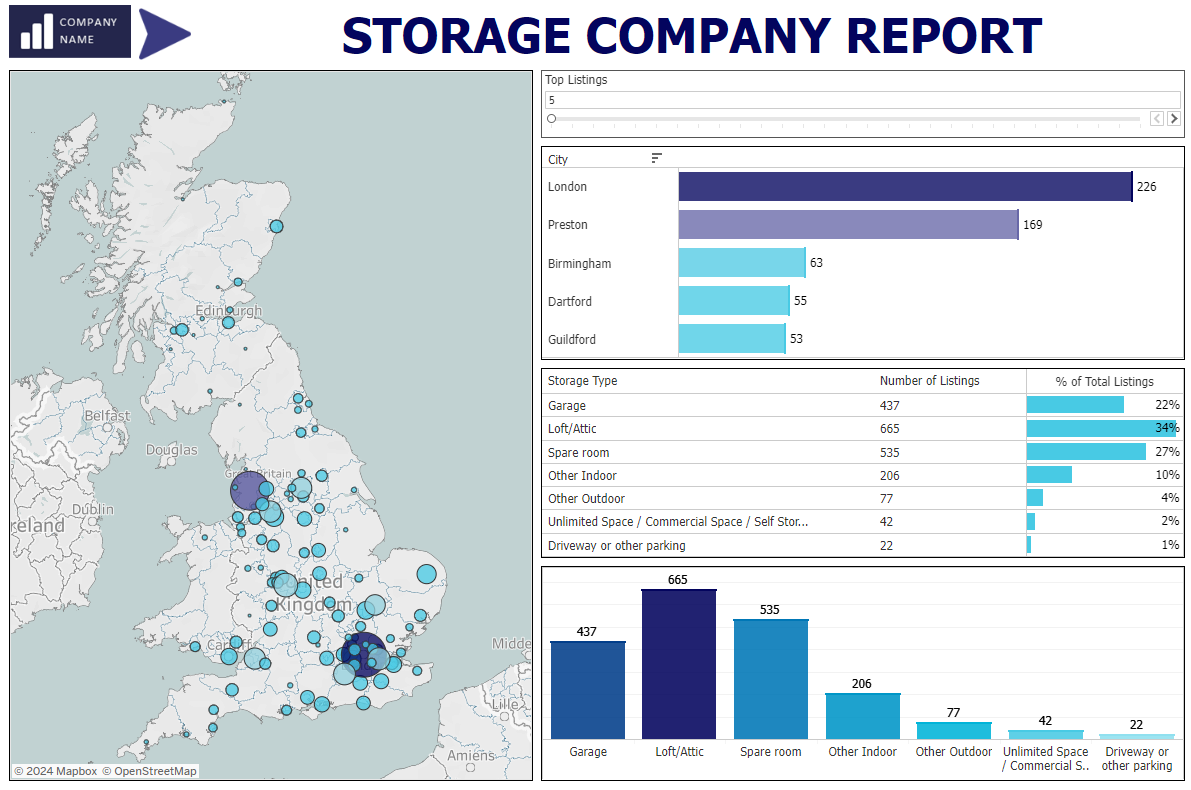
I analyzed data from this Storage company to create a report, which reveals insights into regional and type-specific storage preferences.
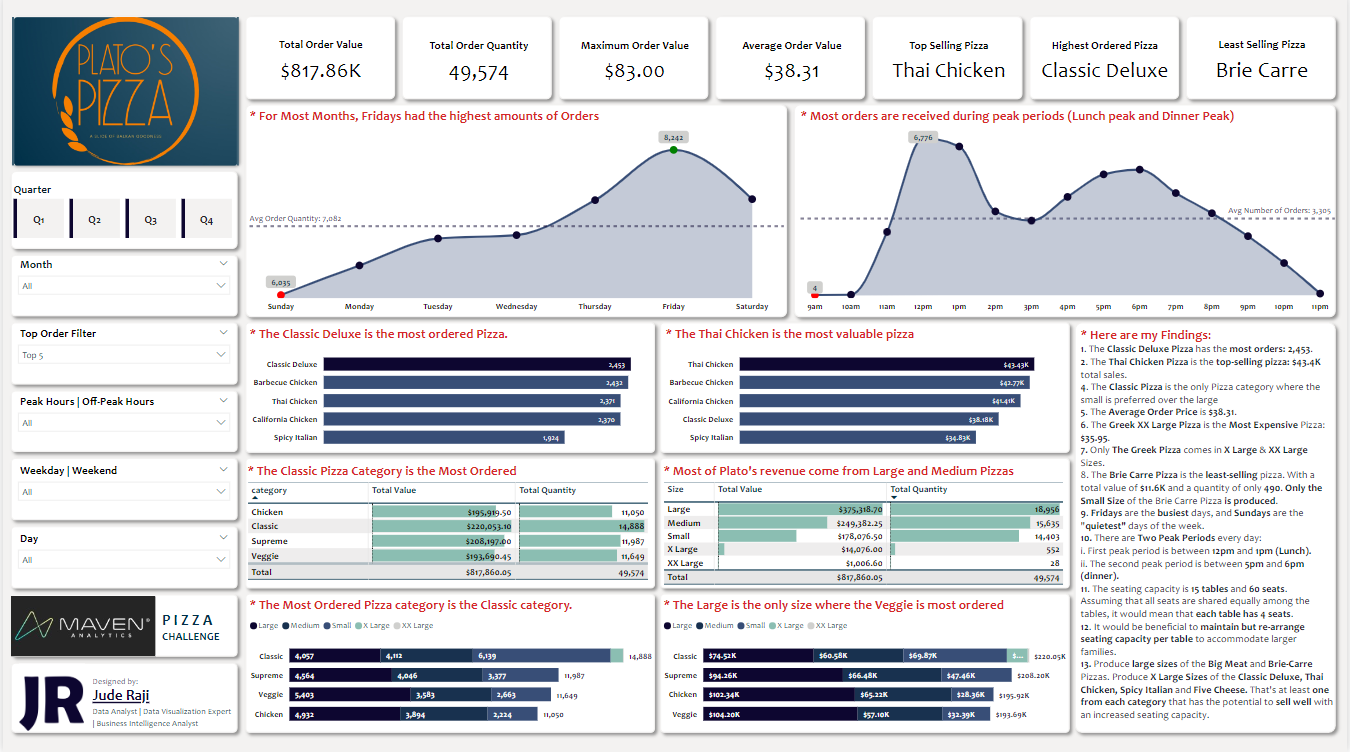
I optimized my Pizza Sales Power BI Dashboard using Power Query. Read more to see how I took steps to reduce the response time, reduce resource consumption, enhance data quality and increase user confidence in the dashboard.